

After you’ve onboarded a new client to your agency and have their campaigns up and running, it’s common that the majority of communication will come in the form of client reporting.
The frequency and format of each report will change for each client, although there’s no question that client reporting is one of the best ways to demonstrate the value of your services and retain clients over the long-run.
As you start to grow the agency, however, it’s likely you’ve encountered something that many other agencies experience: manual reporting doesn’t scale.
Between collecting, aggregating, and visualizing data—the time it takes to manually generate your own client reports adds up quickly and can be a significant bottleneck to growth.
For this reason, client reporting should be automated as much as possible.
In this article, we’ll discuss exactly how to automate your client reporting from start to finish, including:
- What to Include in Client Reports
- Data Storytelling in Your Client Reporting
- Report Automation: How to Streamline Your Agency
Let’s get started.
What to Include in Client Reports
The content of each report will of course change based on the type of marketing you’re doing, although there are common features that every report should include.
To give you an idea of what client reports should include, below are the seven sections that we’ve included in AgencyAnalytics’ digital marketing report template:
- Report Summary
- Google Analytics – All Channels
- Google Analytics – Goals (Conversions)
- SEO Rankings
- Social Media Overview
- PPC Overview
- Email Overview
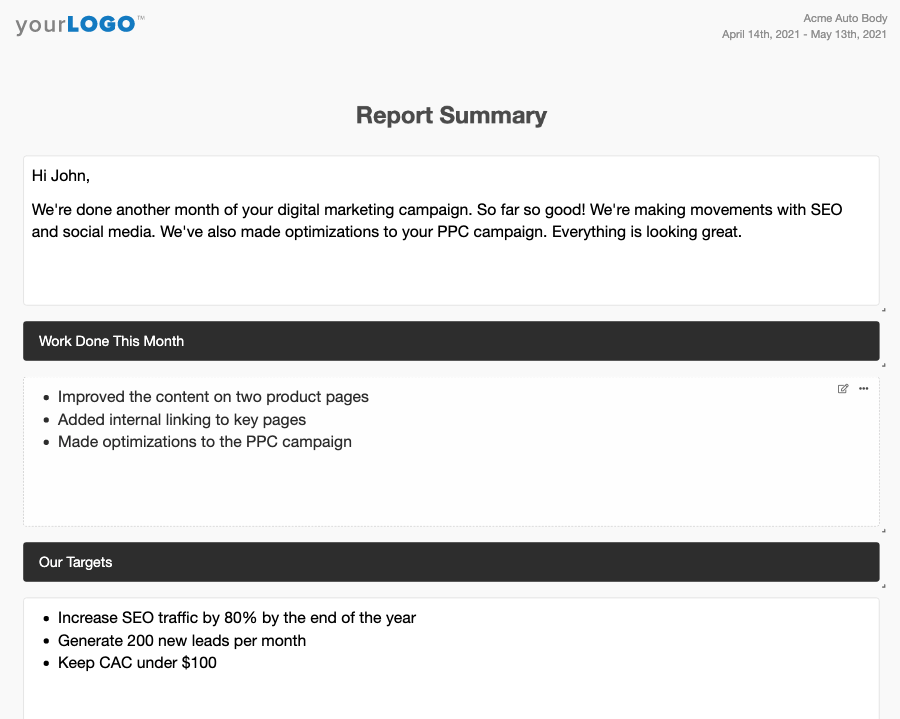
Report Summary
The reality is that many clients won’t understand all the technical details of each marketing campaign, which makes the report summary incredibly important. This section gives you the opportunity to write out your analysis of the past month’s performance and outline the plan going forward.
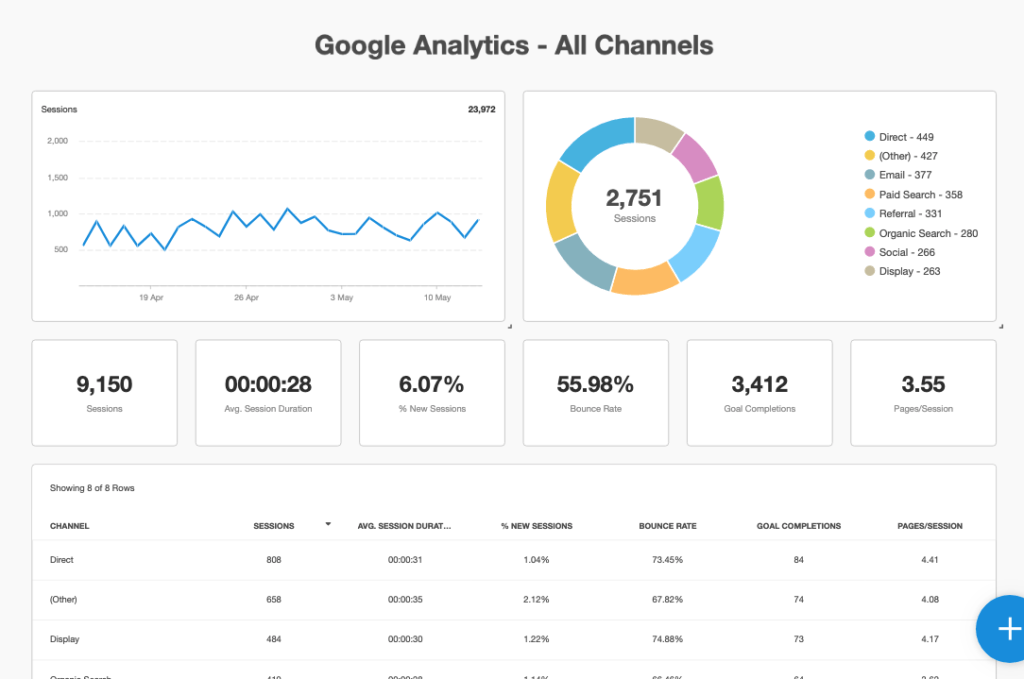
Google Analytics – All Channels
The Google Analytics – All Channels section displays the overall success of the campaign, including the total number of visitors, visitor sources, and KPIs such as average session duration, bounce rates, and conversions. The goal of this section is not only to inform your client which channels are performing well, but can also help direct your marketing strategy for the following month.
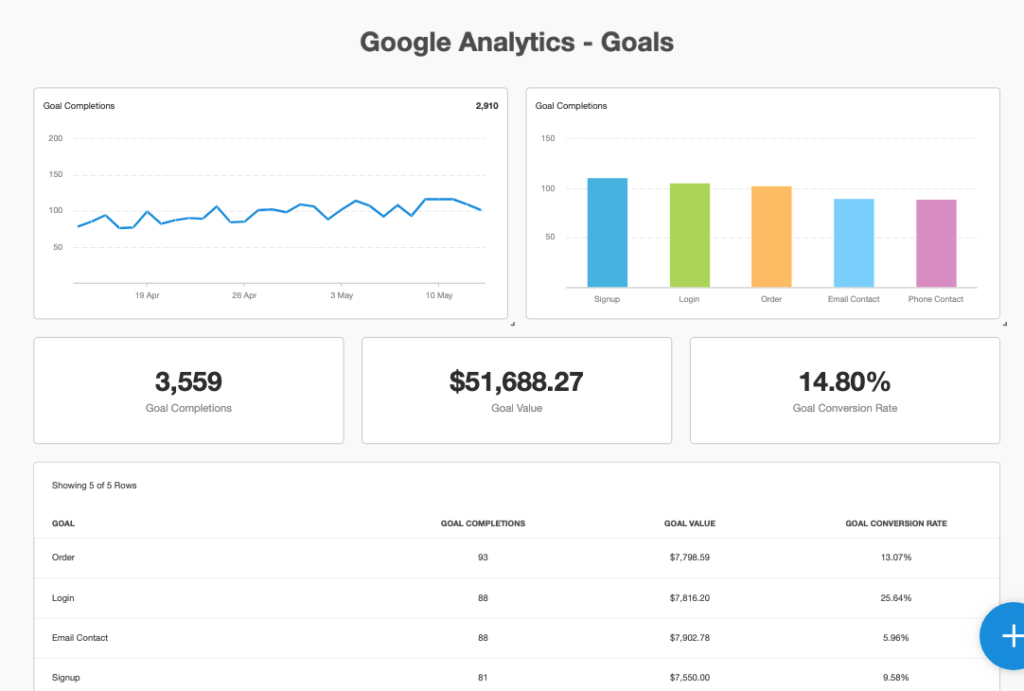
Google Analytics – Goals
Next, we have a section for the number of conversions, or Goals, which in Google Analytics can mean anything from email signups to purchases. This section provides clients an understanding of their overall ROI for each channel and also gives a granular look at metrics related to goal completions such as the dollar value and conversion rate.
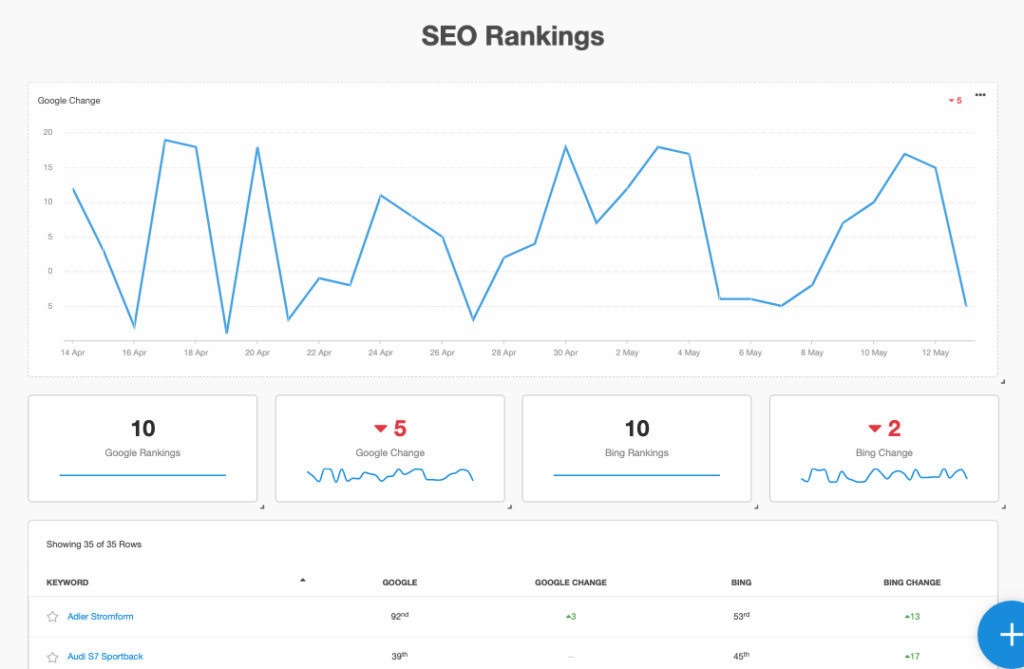
SEO Rankings
SEO rankings allows you to track and report on search engine rankings on both Google and Bing. You can also see how rankings are changing over time, allowing you to identify which keywords may need more attention next month.
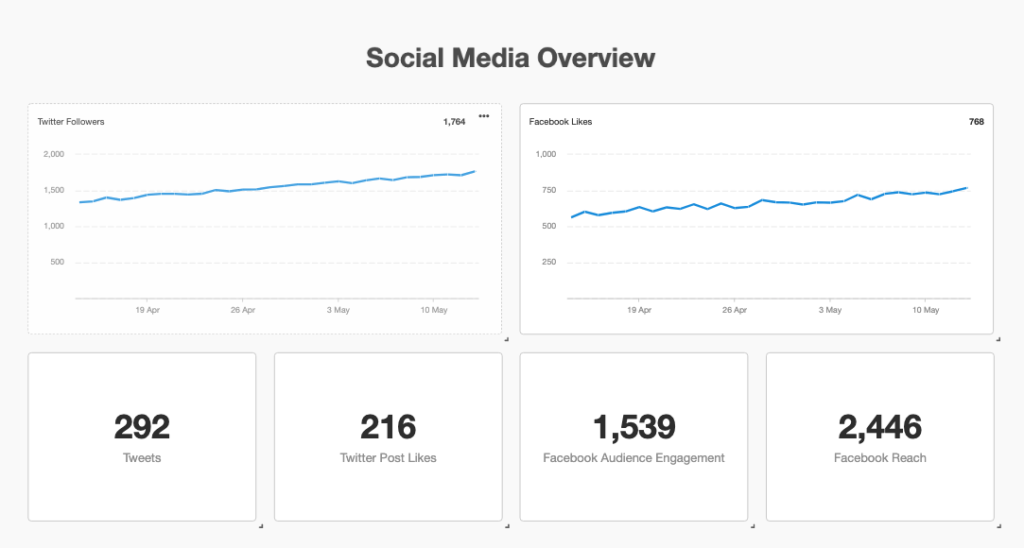
Social Media Overview
The social media overview shows your client the most important metrics and KPIs for each platform they’re on. This includes audience engagement metrics such as total followers, post engagement, reach, and so on.
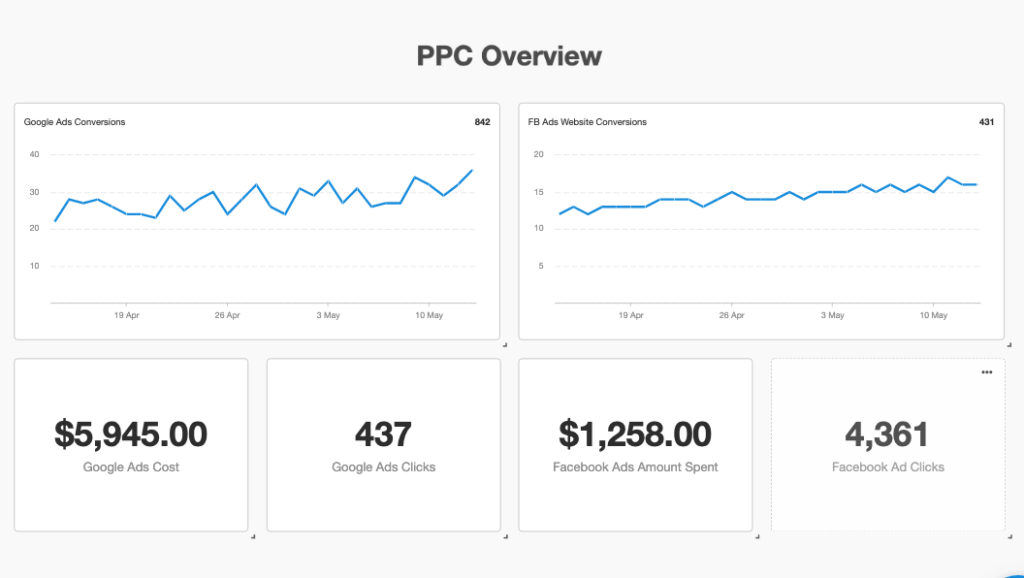
PPC Overview
Next, we have an overview section to track pay-per-click (PPC) campaigns across multiple platforms. This includes metrics such as total ad costs, cost-per-click, conversions, impressions, and more.
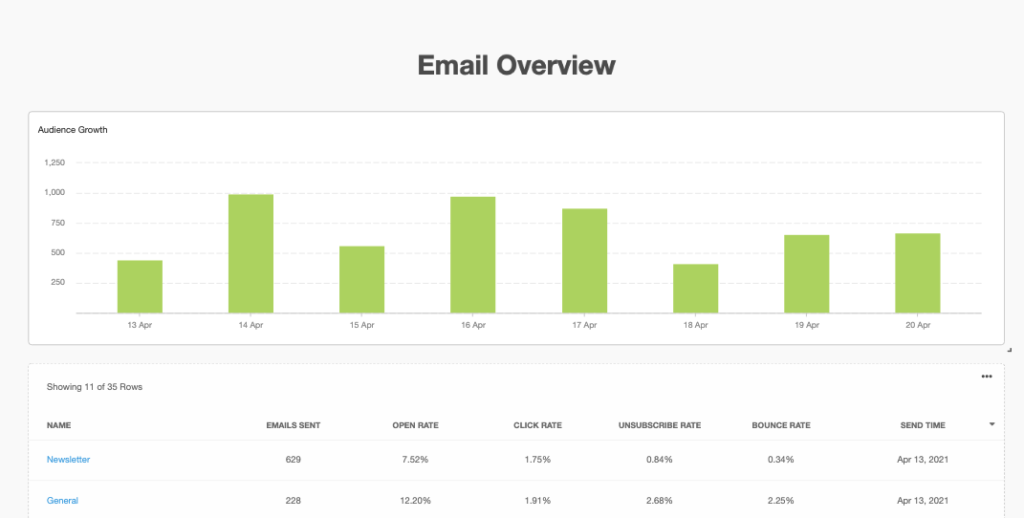
Email Overview
Finally, if you’re managing email marketing campaigns for your clients, this section allows you to track key metrics such as open rate, click-through-rate (CTR), and the growth in subscribers throughout the month.
Data Storytelling in Your Client Reporting
Now that we’ve discussed what to include in your client reports, let’s discuss how you can take reporting a step further and tell a compelling story with your data.
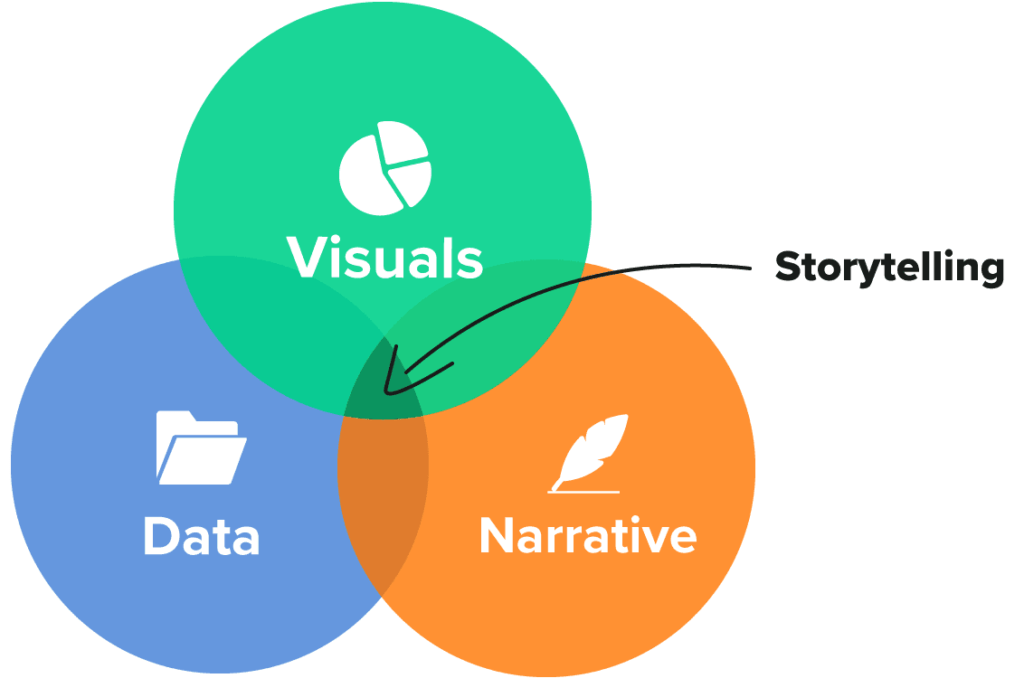
Data storytelling refers to the process of transforming raw data into a narrative that highlights key changes, patterns, or trends. This is accomplished by combining three core features:
- Data: Data storytelling first requires that you collect and aggregate the data into a unified location. One of the main benefits of reporting software is that data is automatically retrieved from various sources with an API.
- Visualization: The next step is to take the raw data and apply data visualization so that anybody can understand it, regardless of technical expertise. This allows you to transform raw data into actionable insights uncovering trends and patterns in the data.
- Narrative: Finally, data storytelling should include a narrative to describe the importance of the data and highlight any important KPIs.
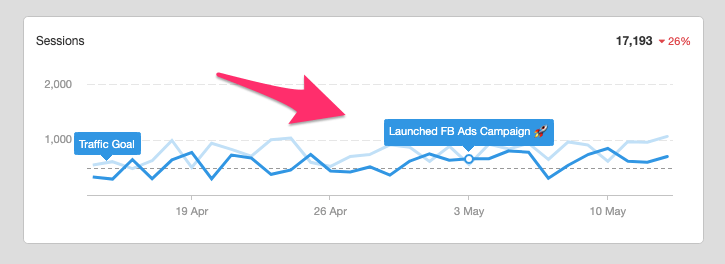
One example of data storytelling in client reporting is to add annotations and goals to your line charts and date-based column charts. As you can see below, this feature gives enables you to to highlight key changes directly within each chart:
Report Automation: How to Streamline Your Agency
The last critical piece of client reporting is automation. Although the initial setup of your client reporting will take some time, report automation allows you to only focus on the most high-value tasks such as improving results and adding your own unique insights to each report.
It’s important to note that automation won’t happen overnight and instead involves continuously tweaking and improving your processes. That being said, a few of the most crucial steps towards building an automated client reporting machine includes:
- Centralizing your data
- Leveraging report & dashboard templates
- Creating best practices for client communication
- Assign data views & governance
- Empowering your sales team
Data Centralization
One of the most challenging parts of client reporting is pulling data from various marketing sources into a single view. For example, with the 60+ marketing integrations at AgencyAnalytics you can avoid wasting time by switching between accounts and streamline your campaign monitoring in a single, intuitive interface.
Leverage Report & Dashboard Templates
After centralizing your data into a single view, the next step is to leverage report and dashboard templates. It may be the case that you want to start from scratch and create a completely customized report, although typically templates can be a good starting point that can be modified slightly for each client. Report templates allow you to focus your efforts on campaign results, ultimately enabling you to scale much more efficiently.
Create Best Practices for Client Communication
After you’ve set up your client reports initially, the best practices for client communication is something that should be clearly defined within the agency. Client communication may differ slightly based on the clients needs, so it’s generally recommended to determine this in your onboarding process.
Assign Data Views & Governance
Whether you’ve decided to send periodic reports or provide 24/7 access to a live dashboard, the next step is to provide access to clients. If you choose to go with periodic reports this can be done by scheduling automatic emails to your team each month. If you choose to go with a live dashboard, you can give your clients their own login to access and completely customize each user’s permissions, so clients see only what they need.
Workflow Automation
Aside from automating individual report generation, the final step is to automate your agency’s workflows. One way to do this is with our suite of agency tools, which allows you to create staff accounts, assign them tasks, and monitor the progress.
Summary: Automated Client Reporting
Client reporting is an essential part of building and scaling a successful agency. That said, manually creating reports can often be a bottleneck that is both time-consuming and inefficient. Instead of manually collecting, aggregating, and visualizing data, reporting software allows you to automatically pull in this data through an API so that you can focus on more high-value tasks.
In summary, automated reporting software offers a number of time and cost benefits for agencies — a few of the most notable include the high-quality consistency of your reports, the scalability they offer, and the ease of client communication they provide. If you’re ready to get started automating your client reporting, start your free trial of AgencyAnalytics today.